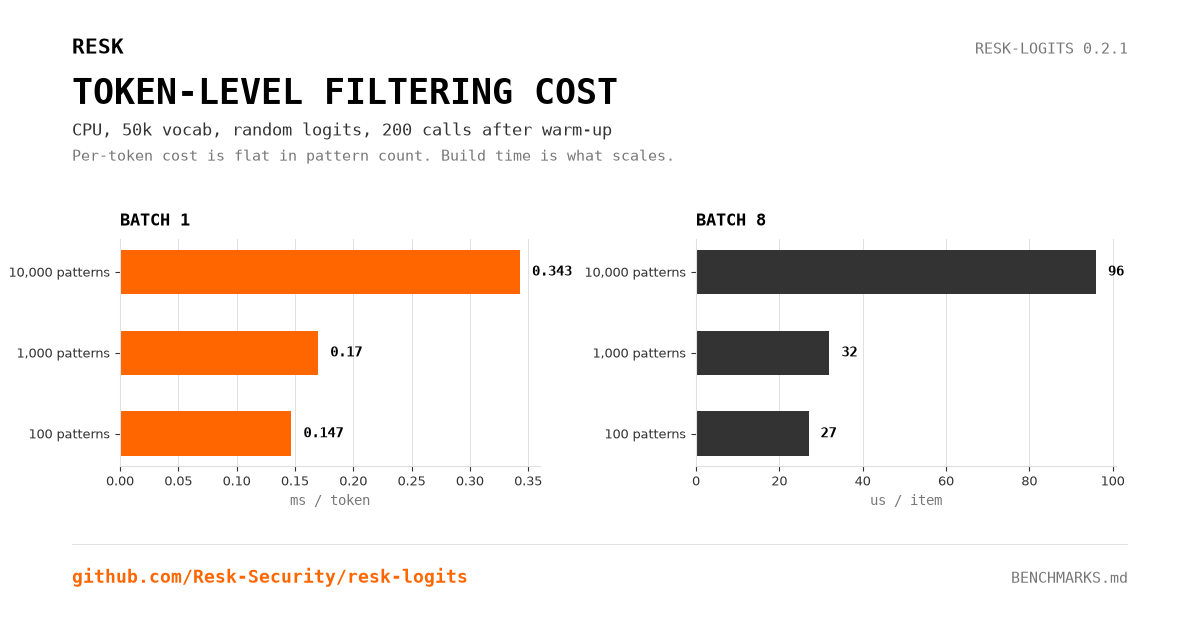
Token-level filtering adds 0.147 to 0.343 ms per decoded token on CPU for 100 to 10,000 banned patterns, according to a benchmark we can reproduce in one command. The per-token cost is flat in the number of patterns; what scales is the one-time automaton build.
This post exists because a benchmark you cannot rerun is marketing. The script, the raw JSON and the machine details are in the repository. If your number differs, your hardware and your tokenizer are the explanation, and the command is the arbitration.
What was measured
| Parameter | Value |
|---|---|
| Device | CPU, no GPU claimed |
| Vocabulary | 50,257 tokens |
| Sequence length | 32 |
| Batch sizes | 1 and 8 |
| Iterations | 200 timed calls after warm-up |
| Patterns | 100, 1,000, 10,000 |
| PyTorch | 2.12.1 |
| Python | 3.14.8 |
Results
| Patterns | Build | Batch 1, mean | Batch 1, p95 | Batch 8, per item |
|---|---|---|---|---|
| 100 | 0.4 ms | 0.147 ms/token | 0.165 ms | 27 µs |
| 1,000 | 4.3 ms | 0.170 ms/token | 0.207 ms | 32 µs |
| 10,000 | 40.8 ms | 0.343 ms/token | 0.429 ms | 96 µs |
How to read the numbers
The inference path is O(1) per token with respect to pattern count: the automaton, failure links and danger mask are built once, then each step applies a precomputed mask. That is why 100 and 1,000 patterns cost almost the same per token, and why 10,000 patterns cost roughly twice as much rather than a hundred times more.
Build time is the real scaling cost. Forty milliseconds for 10,000 patterns is a startup cost, not a per-request cost — as long as you build the processor once and reuse it. Rebuilding it per request would dominate everything else, and that is an application bug, not a library property.
Batching amortizes the fixed Python and tensor overhead. At batch 8, the per-item cost drops to 27–96 µs. If your serving stack batches, the relevant number is the right-hand column, not the headline.
Do not convert milliseconds into a percentage without measuring your model step. A 0.343 ms overhead is about 1% of a 30 ms decoding step and about 0.3% of a 100 ms step. The percentage is a property of your workload, not of the filter.
What this benchmark does not measure
- Detection quality — recall, false positives, or resistance to paraphrased attacks.
- GPU performance — the mask operation moves to the device, but we do not publish a GPU number we have not reproduced on named hardware.
- End-to-end latency — network, sampling, tokenizer and framework overhead are excluded.
- Model quality impact — a penalty changes the distribution; whether that is acceptable is an evaluation question.
The previous changelog mentioned a vendor figure of roughly 0.001 ms per token on GPU. We removed that claim from the current documentation because it is not reproducible here. If you need a GPU number, run the script on the target card and publish the JSON next to it.
Reproduce it
git clone https://github.com/Resk-Security/resk-logits
cd resk-logits
pip install -e ".[dev]"
python3 benchmarks/benchmark_processor.py \
  --patterns 100,1000,10000 --batches 1,8 --iterations 200
The output is written to benchmarks/results.json. The repository also contains the full methodology and caveats.